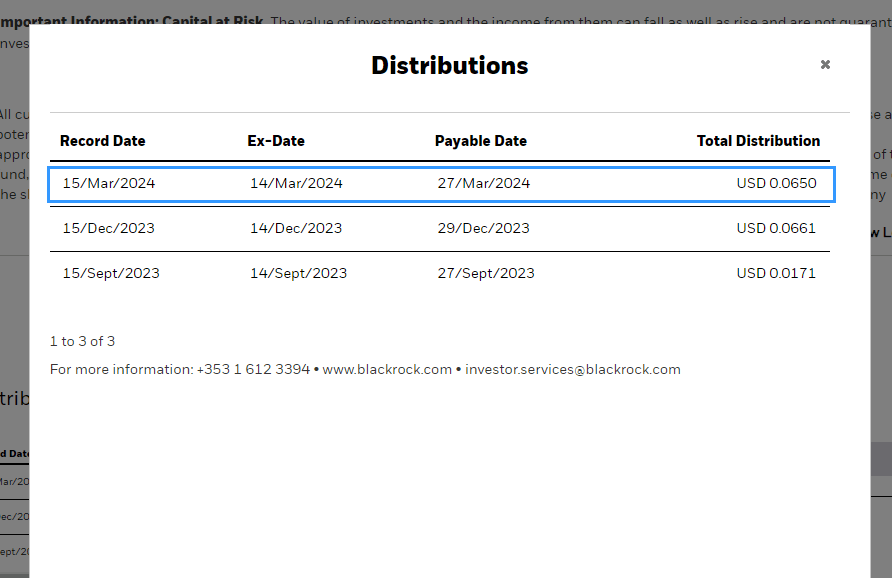

My Dividend Experience Investing in UCITS iShares iBond Maturing in 2028.
Shortly after I wrote that we could buy Irish domiciled corporate bond ETF that has a fixed maturity half a year ago, I decided to …
Shortly after I wrote that we could buy Irish domiciled corporate bond ETF that has a fixed maturity half a year ago, I decided to …
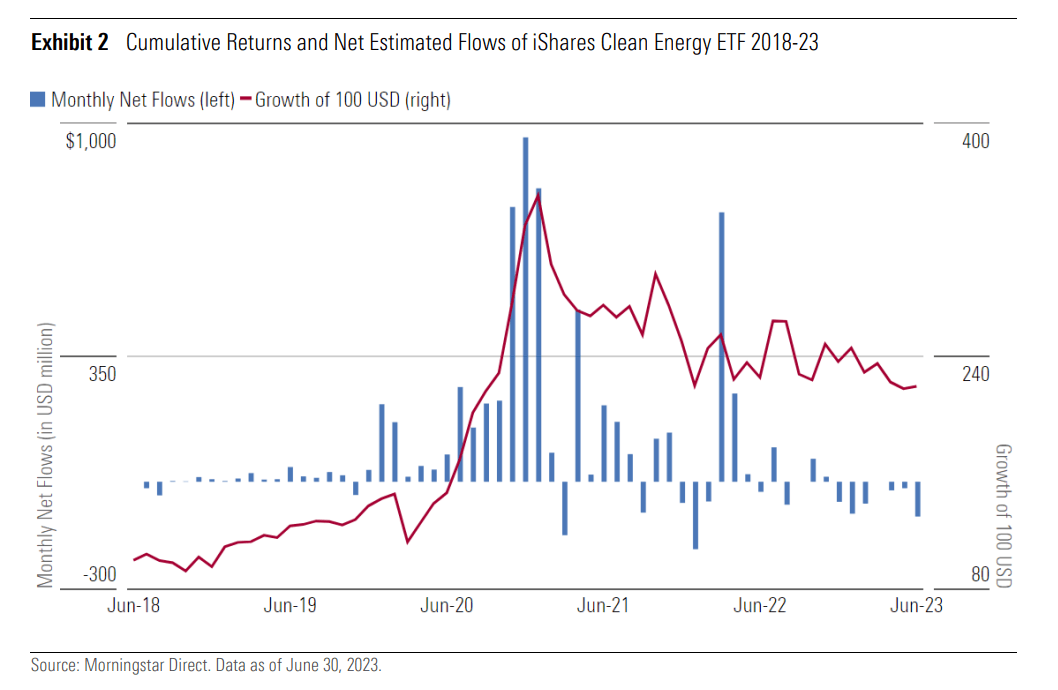

My co-worker shared with me a 2023 Morningstar Investor Returns Around the World report. This report should rename how investors often invest exactly at the …


Seven and a half years ago, I let readers into my world of meal prep. We basically meal prep what we eat later in the …
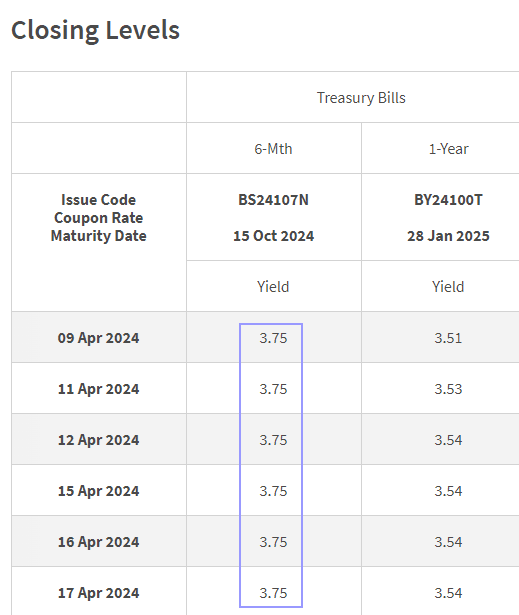
A Singapore Treasury Bill issue (BS24108V) will be auctioned on Thursday, 25th April 2024. If you wish to subscribe successfully, get your order via Internet …

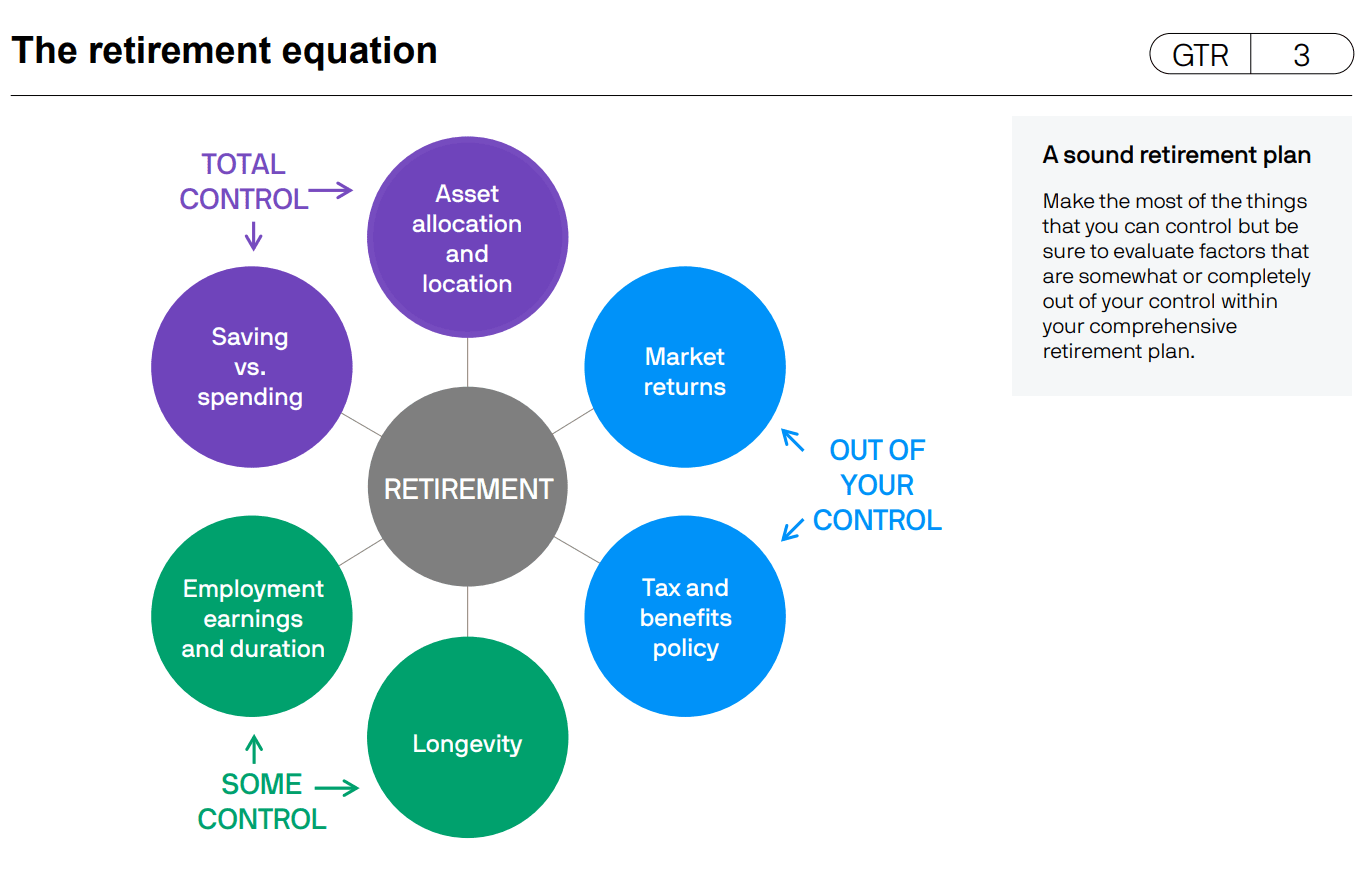
JPMorgan came up with a nice slide deck showcasing their data collection about things related to retirement planning. If you are interested in planning for …

In BlackRock Chairman and CEO Larry Fink’s 2024 letter to shareholders, he highlighted potentially countries took a peep at the U.S. and wonders what they …
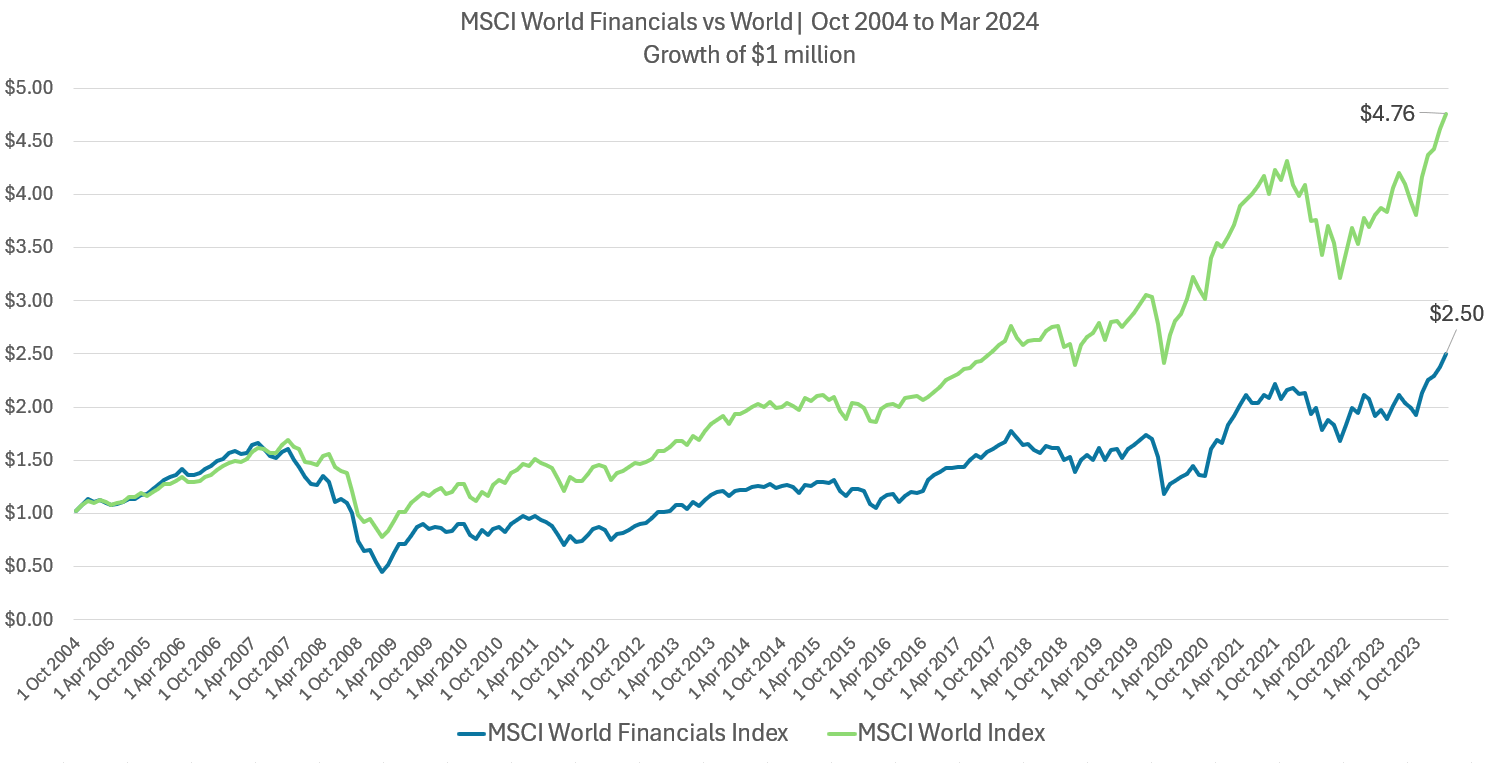
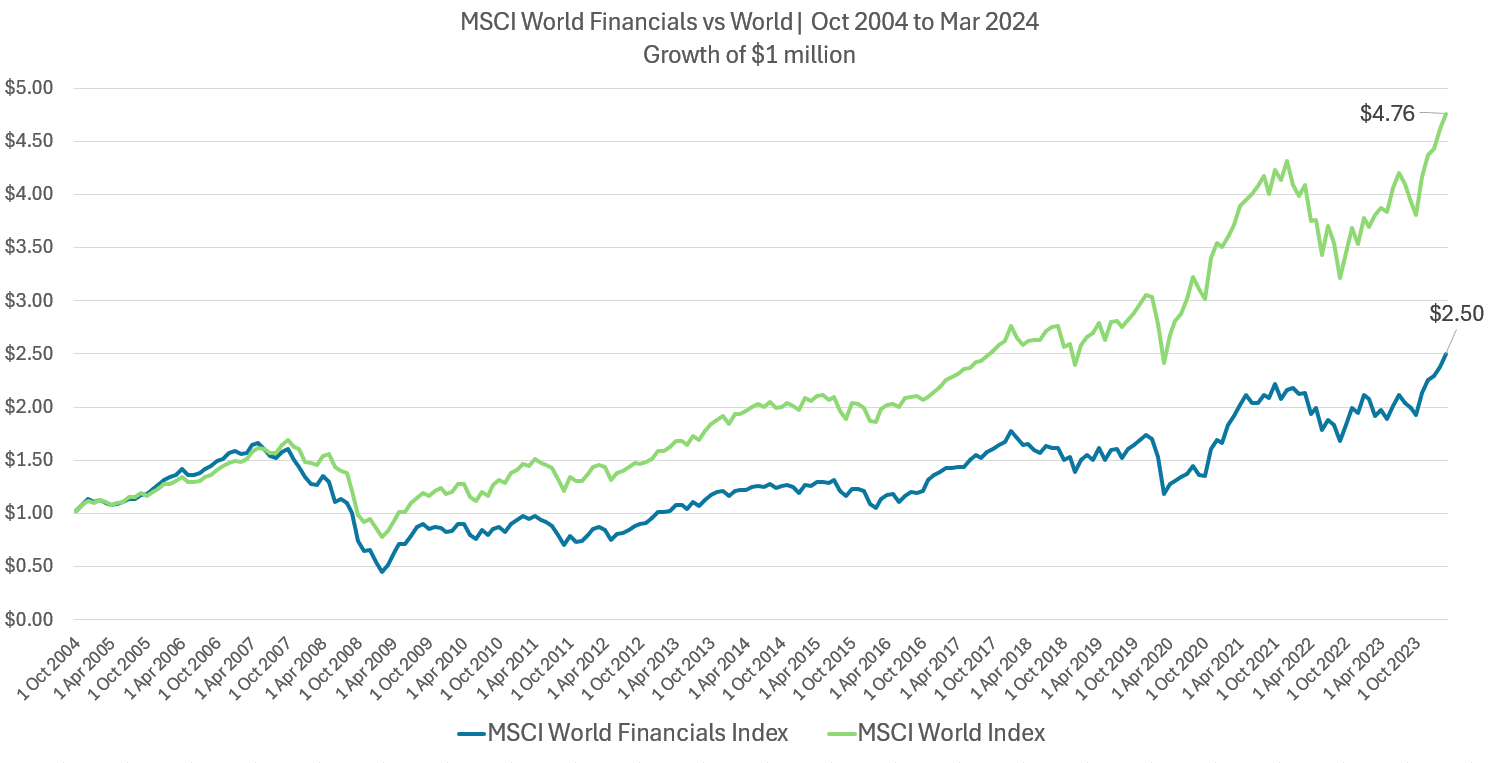
LionGlobal came up with this new ETF called the APAC Financials Dividend Plus ETF. The APAC Financial Dividend ETF is the most obvious ETF that …
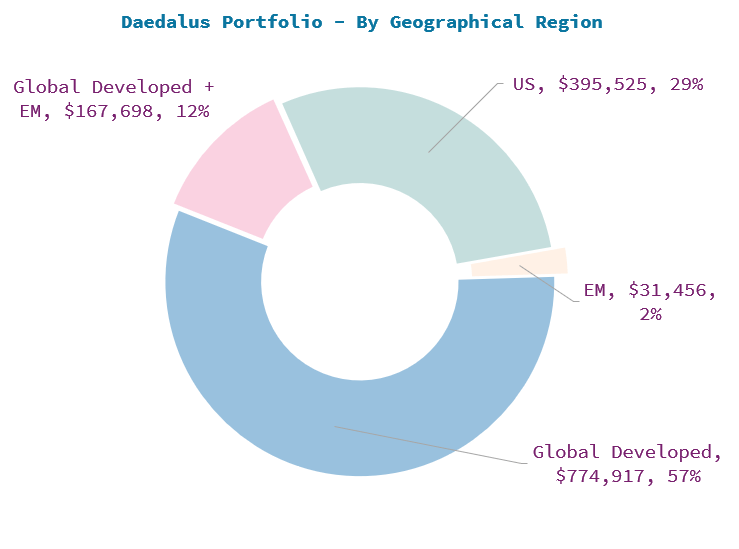

In this post, I will explain further about the main portfolio which makes up the majority of my net wealth. The bulk of this portfolio …

About a month ago, I reflected upon the short-term underperformance of a Nikko Shenton fund in Dealing with Short-Term Underperformance is Tough. Reflecting on Nikko …

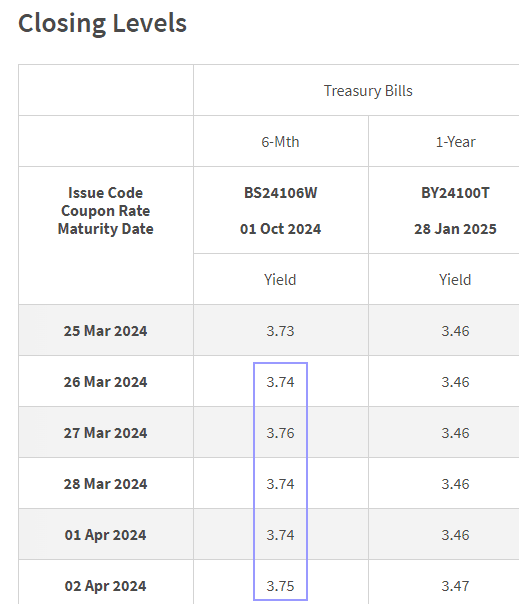
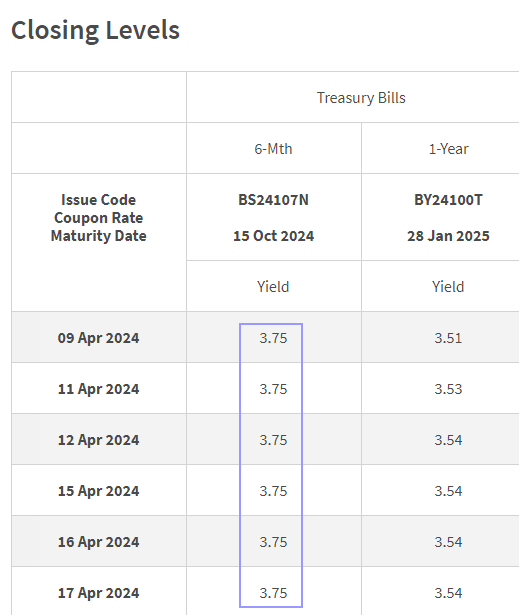
A Singapore Treasury Bill issue (BS24107N) will be auctioned on Thursday, 11th April 2024. If you wish to subscribe successfully, get your order via Internet …
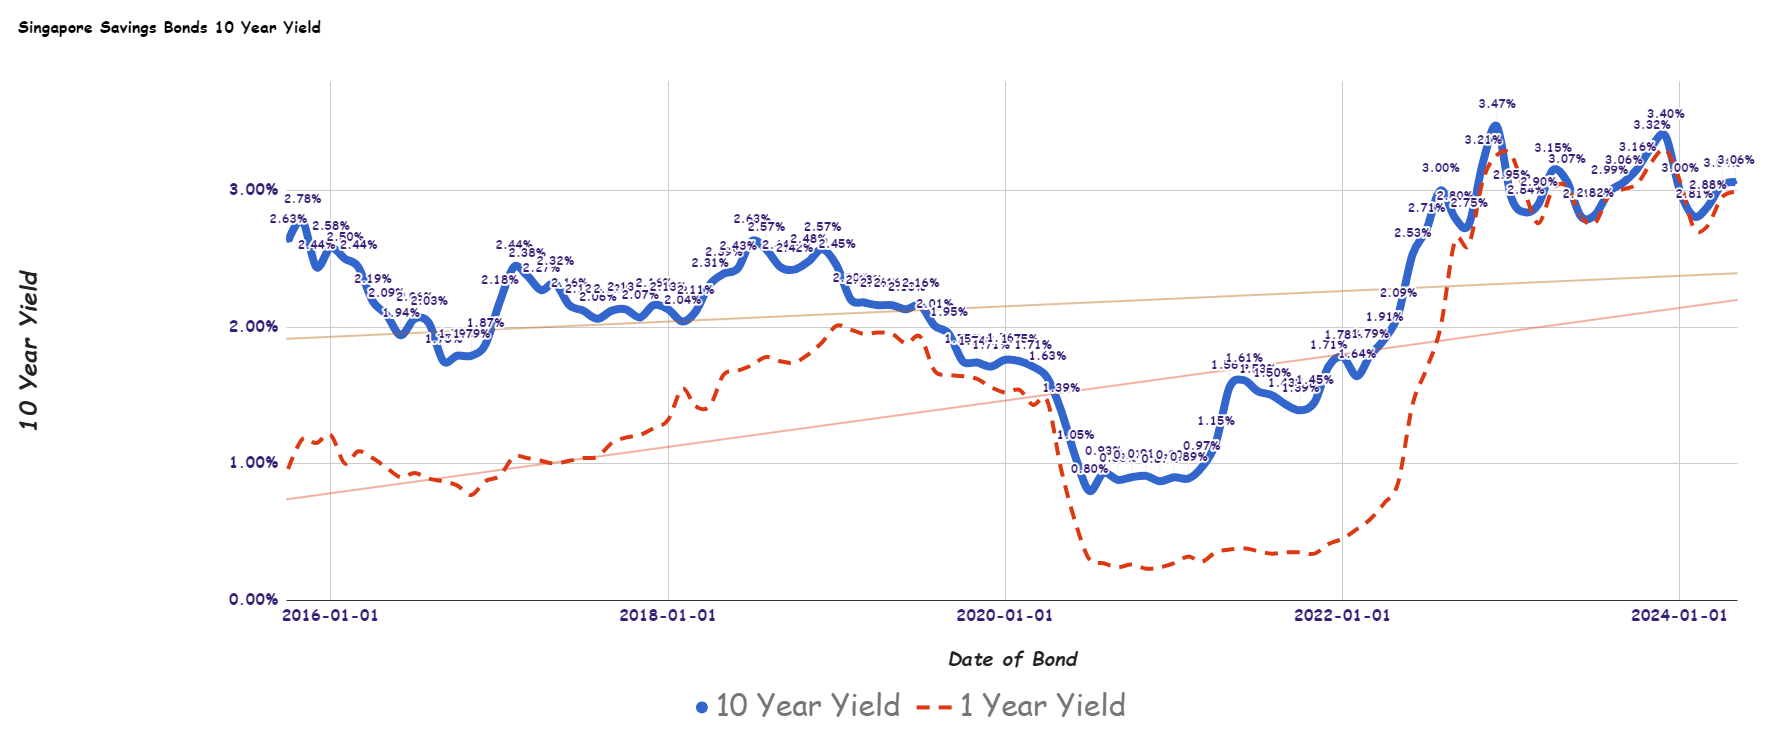
Here is a safe way to save money that you have no idea when you will need to use or your emergency fund. The May …