Option overview
An option is a right to buy or sell an asset for a specified price and time.Let’s say you want to by a TV on sale at Wal-Mart. You drive there only to find out that it’s "sold out". So you go to the clerk and ask for a "rain check".
This "rain check" is a guarantee that you will get the TV for the sale price when they are back in stock. There may be an expiration date on the "rain check" for 1 month from the out of stock date.This rain check qualifies as an Call option.
You have the right to purchase the TV for the sale price up to 1 month regardless of how much the TV goes up or down in price during that period. You are the buying this call option and Wal Mart is the seller. The only difference of this rain check versus a real option is that there is NO value on this option and it is probably non-transferable.
Now, let’s use this same concept for a stock.
For instance, you want to buy Microsoft stock and it is trading at $50 a share. Instead of buying the stock, you decide to purchase a "right to buy the stock at 50" which will expire on 1/15/01. You would be willing to pay $3 for this right to buy Microsoft before 1/15/01 at $50.
On the other side of this deal, there is someone who is willing to sell you this right for you to buy Microsoft from him for 50. He wants $3 for granting you this contract.
Comparison table: Stock option VS Rain check for TV
|
Option components: |
Stock
|
Rain check for TV |
|||
|
Expiration Date
|
1/15/2000
|
1/15/2000 |
|||
|
Strike (exercise) price
|
50
|
500
|
|||
|
Call (buy) or Put (sell)
|
call
|
call
|
|||
|
Option price
|
3
|
NO VALUE (non transferrable)
|
|||
Introduction
Profit loss VS Price graphs are by far the simplest and most powerful way to communicate the risk and reward assoicated with any option or option spread (two or more options).
Back to the Microsoft stock option example from above.
You decided to go ahead and buy the call option (right to buy) on on microsoft for 50 per share by 1/15/2001 for $3 per share.
The contract size is 100 shares.
Profit (loss) vs Price table
|
Profit (loss)
|
Price – microsoft stock
|
||
|
-300
|
30
|
||
|
-300
|
40
|
||
|
-300
|
50
|
||
|
700
|
60
|
||
|
1700
|
70
|
||
As we can see, you cannot lose more that the price you paid for the option of $300.
Your profits are same as if you had bought Microsoft stock less the option price.
Chart description
The PL vs Price graph consists of: Profit or (loss) of the position plotted on the Y-axis. Underlying price plotted on the X-axis. (underlying: is the stock, future, or index of the options)
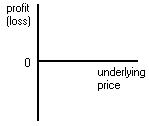
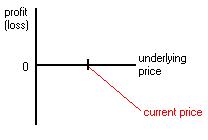
The current price of the underlying is located in the center of the X-axis underlying price range.
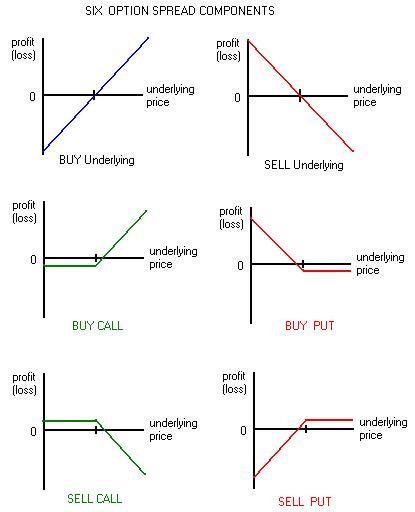
Buying or Selling the Underlying:
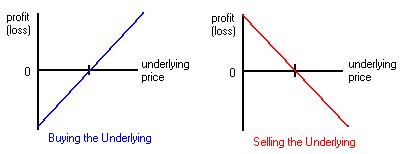
These two graphs represent just buying or selling the instrument (stock, future, index).
They are simply 45 degree lines which intersect at the current underlying price.
For every dollar the underlying price moves up or down, there is an incremental profit (loss) movement. Selling the Underlying also is known for stocks is known as shorting the stock (selling the stock without first owning it).
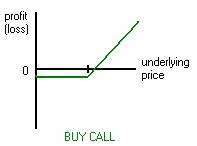
Buying a call option:
(a call option is: a right to buy an underlying for a specific price and time period)
The above graph is shows the profit or loss of buying a call option for a range of projected underlying prices at expiration day for the call option.
Notice below that the loss is limited to the price of the call option if the underlying price at options expiration is LOWER than the current underlying price.
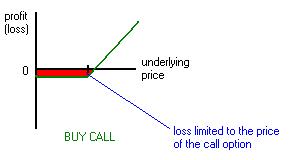
Profit and Loss moves incrementally (45 degree angle) if the underlying price at options expiration day is GREATER than the underlying price today.
Buying a put option:
(a put option is: a right to sell an underlying for a specific price and time period)

The above graph is shows the profit or loss of buying a put option for a range of projected underlying prices at expiration day for the call option.
Notice below that the loss is limited to the price of the put option if the underlying price at options expiration is HIGHER than the current underlying price.
Profit and Loss moves incrementally (45 degree angle) if the underlying price at options expiration day is LESS than the underlying price today.
Selling call or put options
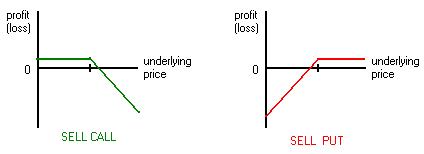
The above graphs show the profit and loss at options expiration for selling a call or put.
Notice below that the losses for selling calls are puts are virtually UNLIMITED.
But the profit is limited to the price of the option.

Recap, six option spread components:
Spreads
A spread is two or more of the above six components combined.
For example, if you combine buying a call and buying a put together, this forms a spread known as a straddle:
The straddle spread is a strategy which would profit if the underlying moved considerably
up or down. Remaining the same would cause a loss limited to the combined prices
of the call and put options.
This position could be reversed to selling a put and selling a call known as a Short Straddle spread.
The above Short Straddle position is a neutral strategy profitable if the underlying price remains the same. Maximum profit is the combined prices of the call and put options and maxiumum loss is unlimited.
Another common spread position is known as a covered call.
This is formed by buying the underlying and sell a call.
The covered call spread works precisely the same as the SELL PUT position.
Your maximum profit is the price of the call. Your maximum loss is the value of the underlying less the call you sold. You would make money so long as the underlying stayed the same or moved up.
Varying the Strike Price
Strike price is the price of the underlying that you have the "option" to buy or sell for.
For example, a 50 call would mean that you have a right to buy the underlying for 50 before a certain date.
All call and put options have a series of strike prices.
This series has a center as the current price of the underlying.
For example, if a stock is trading at 50.. the center strike price would be 50. This strike is also known as the "at the money" option.
Stock A with a current price of 50 has the following call options:
|
strike
|
call price
|
|
|
30
|
21
|
|
|
40
|
12
|
|
|
50
|
3
|
<= At the money Call
|
|
60
|
2
|
|
|
70
|
1
|
The 50 call would be the "at the money" call since it is closest to the underlying current price of 50.
An "in the money" call would be any call with a strike price LESS than the at the money call.
|
strike
|
call price
|
|
|
30
|
21
|
<= In the money Call
|
|
40
|
12
|
<= In the money Call
|
|
50
|
3
|
|
|
60
|
2
|
|
|
70
|
1
|
An "out of the money" call would be any call with a strike price GREATER than the at the money call.
|
strike
|
call price
|
|
|
30
|
21
|
|
|
40
|
12
|
|
|
50
|
3
|
|
|
60
|
2
|
<=Out of the money Call
|
|
70
|
1
|
<=Out of the money Call
|
Recapping the Call options chain:
|
strike
|
call price
|
|
|
30
|
21
|
<= In the money Call
|
|
40
|
12
|
<= In the money Call
|
|
50
|
3
|
<= At the money Call
|
|
60
|
2
|
<=Out of the money Call
|
|
70
|
1
|
<=Out of the money Call
|
The Put options chain is the call chain in reverse:
|
strike
|
call price
|
put price
|
|
|
30
|
21
|
1
|
<=Out of the money Put
|
|
40
|
12
|
2
|
<=Out of the money Put
|
|
50
|
3
|
3
|
<= At the money Put
|
|
60
|
2
|
12
|
<= In the money Put
|
|
70
|
1
|
21
|
<= In the money Put
|
Put options are valued at the opposite of call options.
An "Out of the money" Put strike would be an "In the money" Call strike.
When we view the PL chart for varying CALLS, we see that the in the money calls have higher maximum losses, but a lower break even price.
The PL chart for varying PUTS show that the in the money puts have a higher maximum loss and higher break even price.
Selling varying call and put strikes are shown below:
Credit and Debit Spreads
A very common and effective 2 option spread strategy is the credit or debit spread.
This spread consists of buying one call option of a particular strike price and selling another call option of a different strike price. (You can
also do the same for puts.
The main difference between the credit versus debit spread is that in a credit spread, your sell option price will be greater than your buy option price giving you a net credit when you open the position. The debit spread buy price is greater than the sell price giving you a net debit when you open the position.
The call debit spread would be to buy an AT the money call and to sell an OUT of the money call. The PL graph would look like the following:
Notice how the call debit spread has a limited loss as the net option cost of buying and selling the calls. It has a maximum profit as the net difference in the strikes of both calls. For example, assume we buy a 50 call for 2 and sell a 60 call for 1. The maximum loss would be -1, and the maximum gain would be 10.
The Call Credit Spread consists of combining: (buy at call) + (sell in call)
The spread initially gives you a net credit of the sell option price less the buy price.
This is a bearish position which is profitable only as the price of the underlying goes down.
The maximum gain is the net credit of the option prices, the maximum loss is the difference in the option strike prices.
Put credit and debit spreads work the opposite way of Calls
For a Put debit spread we would: (buy at put) + (sell in put)
The spread would give us an initial cost of the difference between the buy option and sell option which would also be the maximum loss. The maximum gain is the difference in the strike prices.
The put credit spread is: (Buy at Put) + (Sell in Put)
It would give you an initial credit of the net cost of the two options with a maximum gain of the difference of the option strike prices. It is a bullish strategy profitable if the underlying price increases.
Option Component Abbreviation Table
Here is an easier way to summarize option components when combining them to construct spreads.
|
CALL OPTIONS
|
PUT OPTIONS
|
|
buy at the money call (bac)
|
buy at the money put (bap)
|
|
buy out of the money call (boc)
|
buy out of the money put (bop)
|
|
buy in the money call (bic)
|
buy in the money put (bip)
|
|
sell at the money call (sac)
|
sell at the money put (sap)
|
|
sell out of the money call (soc)
|
sell out of the money put (sop)
|
|
sell in the money call (sic)
|
sell in the money put (sip)
|
|
buy further out of the money call (bOc)
|
buy further out of the money put (bOp)
|
|
buy further in the money call (bIc)
|
buy further in the money put (bIp)
|
|
sell further out of the money call (sOc)
|
sell further out of the money put (sOp)
|
|
sell further in the money call (sIc)
|
sell further in the money put (sIp)
|
Ratio Spreads
The ratio spread is usually a three option spread strategy with 1 at the money option combined with 2 out of the money options.
Ratio Call = buy at call (bac) + 2 sell out call (sac)
Ratio Put = buy at put (bap) + 2 sell out put (sap)
Ratio Call Backspread = sell at call (sac) + 2 buy out call (boc)
Ratio Put Backspread = sell at put (sap) + 2 buy out put (bop)
The ratio call spread is formed with the options below:
[singlepic=23,430,250]
(Click Image to View)
The ratio call is profitable if the underlying goes down, stays the same or goes up slightly.
Using the above method, we can generate 4 different ratio spread combinations:
As we can see from the above graphs, backspreads have a lower maximum risk but smaller profit range.
4 Option Spreads
Most 4 option spreads form high probability of profit neutral strategies.
This high probability of profit comes from the statistical fact that the the underlying price will most likely remain nearly the same given a time limitation.
There two main types of four option spreads: The butterfly and the iron condor.
The main difference is that the iron condor combines both call and put options whereas the butterfly is call or put exclusive.
butterfly call = buy out call (boc) + 2 sell at calls (sac) + buy in call (bic)
butterfly put = buy out put (bop) + 2 sell at puts (sap) + buy in put (bip)
iron condor = buy out call (boc) + sell at call (sac) + buy out put (bop) + sell at put (sap)
iron condor (flat) = buy further out call (bOc) + sell out call (soc) + buy further out put (bOp) + sell out put (sop)
The butterfly call spread is made of the 4 call options below:
[singlepic=26,430,250]
(Click Image to View)
Notice how the butterfly spread is a neutral strategy being most profitable when if the underlying price stays the same.
Notice also how the loss is limited to the net option price.
The iron condor below uses both call and put options to form its spread:
[singlepic=25,430,250]
(Click Image to View)
This flat iron condor is essentially made up of two credit spreads (1call & 1put). You can visualize how both
credit spreads are overlayed together to form the iron condor.
Notice how the flat iron condor has range of maxiumum profit versus the butterfly having one point.
Overview of all spreads:
[singlepic=24,430,250]
Time decay in PL graphs
When plotting the profit and loss VS price of all of the above positions, we are using Profit and Loss on Options Expiration Day.
What about the Profit and Loss BEFORE expiration?
For any PL vs Price chart, you usually see two plots:
PL vs Price at Expiration AND PL vs Price Today.
Here is what the PL vs price today graph would look like as compared
to the PL at expiration for a the basic options:
Observe how the PL vs Price Today would obviously have a zero profit if you closed the position today and the underlying price stayed the same.
Also note the non-linear nature of a new undecayed option.
The blue undecayed spread line is plotted for all the different spreads below:
[singlepic=22,430,250]
(Click Image to View)
Conclusion on PL graphs
As you can see, PL vs Price graphs are a very effective to communicate how options work together to form specific trading strategies. When in doubt of how your spread strategy will react to any given underlying price change, plot it out on this graph. Once you get the hang of using these graphs, you will be on your way to making more informed options trades.
Kyith is the Owner and Sole Writer behind Investment Moats. Readers tune in to Investment Moats to learn and build stronger, firmer wealth foundations, how to have a Passive investment strategy, know more about investing in REITs and the nuts and bolts of Active Investing.
Readers also follow Kyith to learn how to plan well for Financial Security and Financial Independence.
Kyith worked as an IT operations engineer from 2004 to 2019. Currently, he works as a Senior Solutions Specialist in Insurance Start-up Havend. All opinions on Investment Moats are his own and does not represent the views of Providend.
You can view Kyith's current portfolio here, which uses his Free Google Stock Portfolio Tracker.
His investment broker of choice is Interactive Brokers, which allows him to invest in securities from different exchanges all over the world, at very low commission rates, without custodian fees, near spot currency rates.
You can read more about Kyith here.
- My Dividend Experience Investing in UCITS iShares iBond Maturing in 2028. - April 23, 2024
- We Invest into Popular Funds When They Are Popular, Exactly When They Started Turning to Shxt. - April 22, 2024
- Meal Prep 2.0 – Cooking Your “Go-to” Meal that You Look Forward to Eating Everyday. - April 21, 2024
Drizzt
Thursday 15th of November 2007
What is your blog url in the first place?
regards.
Charls King
Wednesday 14th of November 2007
Hi,
Today I have visited your blog and found some quality information. I think you have maintained a great blog. That's why we would like to exchange links with your blog.
Please send me your link info.
Waiting for your reply.
With Best Regards, charls
Disclaimer: This email is strictly confidential and is requested not to share with anyone.