Drizzt: long term market analysis is a series once or twice a month where we take a look at longer term trends in the market to get our bearings right on the general direction of where market prices is going.
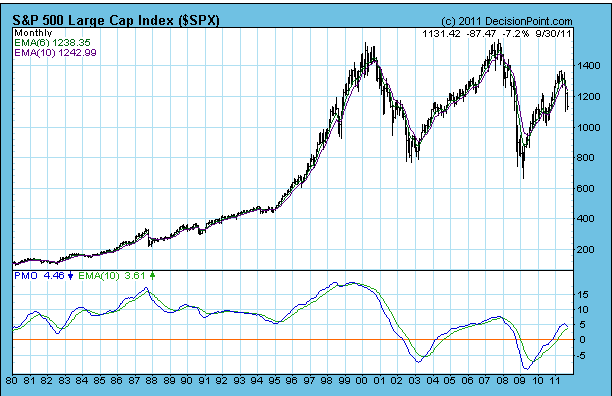
S&P 500 Monthly

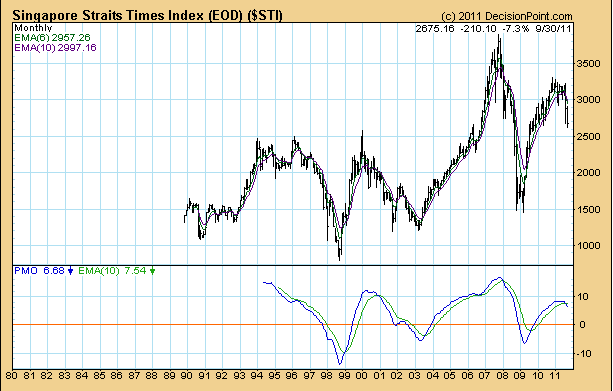
STI Monthly

I will try to keep this short as I don’t see anything different on the monthly charts. On the S&P 500, we lost 7.2% this month. 6 and 10 month EMA made a clean cut through the only saving grace is that the PMO have not indicated a cross over.
It is almost the same for the STI except that the PMO had a cross over.
For the bulls to still make this a correction, we need a strong rally in October, which is traditionally a good month for the bears.
Note, in 2010 we have something similar to this which we thought it’s a turn signal. On the PMO on the S&P 500, there was not a cross over. The PMO didn’t even registered this on the STI.
In the past 20 years we have not seen a point where the PMO cuts the 10 month EMA and then got slingshot upwards. The closes was in 2006, which spark off a great run up.
It doesn’t look very good for the bulls. I kept hearing good experts calling an end to this but the charts are all disagreeing with them.
For those interested in tracking my most current holdings, you can review my portfolio over here. Learn to use our Free Stock Portfolio Tracking Google Spreadsheet to track stock transactions.
Kyith is the Owner and Sole Writer behind Investment Moats. Readers tune in to Investment Moats to learn and build stronger, firmer wealth foundations, how to have a Passive investment strategy, know more about investing in REITs and the nuts and bolts of Active Investing.
Readers also follow Kyith to learn how to plan well for Financial Security and Financial Independence.
Kyith worked as an IT operations engineer from 2004 to 2019. Currently, he works as a Senior Solutions Specialist in Insurance Start-up Havend. All opinions on Investment Moats are his own and does not represent the views of Providend.
You can view Kyith's current portfolio here, which uses his Free Google Stock Portfolio Tracker.
His investment broker of choice is Interactive Brokers, which allows him to invest in securities from different exchanges all over the world, at very low commission rates, without custodian fees, near spot currency rates.
You can read more about Kyith here.
- New 6-Month Singapore T-Bill Yield in Late-April 2024 to Drop to 3.70% (for the Singaporean Savers) - April 18, 2024
- Golden Nuggets from JPMorgan Guide to Retirement 2024. - April 16, 2024
- Be Less Reliant on Banks and Build Stronger Capital Markets by Pushing for Better Shareholder Dividend and Buyback Yield - April 14, 2024
Jeff
Monday 3rd of October 2011
Your STI chart is great! Notice you use decisionpoint.com to do the charting. Any other more common chart sources that can do PMO indicator? EMA is easy to find but PMO don't seem so.
Drizzt
Monday 3rd of October 2011
Jeff, there are many charts on individual US companies using PMO indicators but i think u have to trade US stocks and other indicators extensively to use them