Drizzt: long term market analysis is a series once or twice a month where we take a look at longer term trends in the market to get our bearings right on the general direction of where market prices is going.
The recent upward move in the STI have not allowed folks who are waiting and waiting and waiting to get into the game.
This sort of feels familiar to past bulls where
- the sentiments just cannot be disrupted
- good news or bad news will result in the market moving up
- a rising tide lifts all boats, pennies or blue chips
- the correction is so small that people wait for the bigger drawdown but it just keeps heading up
No one says catching the bottom was easy.
Weekly S&P500 and STI
The long term indicator we use is the cross over between the 17 week EMA and the 43 week EMA. A cut of the 17 week EMA below the 43 week EMA from above signifies an underweight and risk management position. A cut of the 17 week EMA above the 43 week EMA from below signifies an overweight position in equities.

Long term wise the S&P500 looks to be in a bull mode, resuming its uptrend from 2009. Here the 17/43 Week EMA proved a good entry point and exits. But hindsight, you get whipsawed in this small correction, you probably made some losses and commission losses. But that is the price you pay had this be a 50% draw down.

The STI have been lagging, but looks to have a long term buy indicator. 17/43 week EMA is about to have a golden cross. The MACD weekly may cross over above the zero line as well.
MACD Cross over Zero
Here we put a spot light to the MACD move above zero. I find that it is a good indicator to see whether the general trend have changed.
- As dividend investors, you are interested to be in the market for long durations
- Companies you buy at low prices, with fundamental intact will continue to buffer and support your portfolio
- Companies you bought specifically for growth (e.g. STI ETF, Cosco) or at valuations that you deems not cheap (PLife REIT, FCT, VICOM) you may want to reduce to free up capital so that you can buy lower In the case of the long term weekly STI you would have exited a 42% gain. It gets you out of big draw downs like those in 2007-2009 and 2000-2003 where you can save your psychological capital, money capital.
You only catch the big trends.
There are problems with the MACD alone.
- You will generate much buy and sell signals for your portfolio if the market moved sideways long term.
- MACD is lagging and in the cast of STI, you still missed the absolute bottom which resulted in missing 25%
There is no free lunch. You get something that takes away daily market noise and tells the long term trend, but if the trend is going nowhere what would you do?
As a investor you should have a if-else plan before hand what would you do in each situation. That’s why sometimes having your own software program to do this isn’t that bad of an idea.
Correction may be imminent. Long or short?
The US market and STI may be in time for a correction. More images to talk about below. The thing if you are using indicators to see the direction of the markets is that it takes out the distractions and the junk in every day news, and based on that there is every reason that the market will turn next week.
People will say I flip flop my views. Remember I have opinions but opinions do not make money. It is the actual moves that does.
Charting is very much on probability not a crystal ball. When the price changes, your plan grooves along with it. Price movement confirms or discredits opinions.
My opinion is that this would be a place to add more, or initiate a position. However, the MACD and 17/43 weekly EMA on the STI hasn’t even cross over. It may very well resume the draw down.
Have a plan for both situations. I am 48% invested so I would move to 60% where I can. But if the price movement shows that it would resume a big draw down, I would take some losses on the counters I believe are not that cheap.
Overbought signs
There are a few quant blogs and behavioral finance blogs that I followed. They rein me in by providing opposite perspective to my opinion. They prevent me from having a herd mentality when it is not the right time.
One of the recent ones that I like is Evil Speculator. Primarily a currencies quant subscription blog, this entry yesterday contains many sentiment indicators that just flashed WARNING.
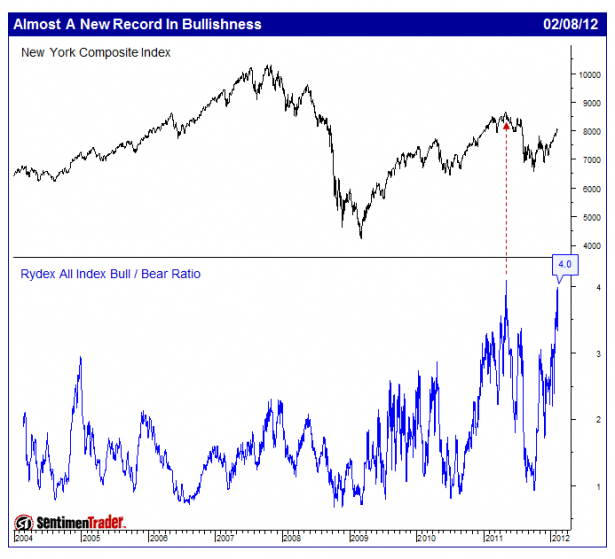
Was it high frequency trading that cause the recent big Rydex bull and bear divergence?
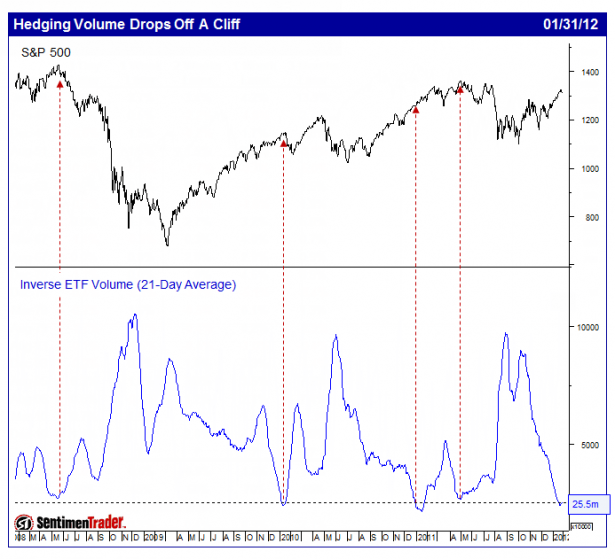
Hedging volume at its lowest, but there are instances in the past that doesn’t really matter that much
For those interested in tracking my most current holdings, you can review my portfolio over here. Learn to use our Free Stock Portfolio Tracking Google Spreadsheet to track stock transactions.
Do Like and +1 if you find it useful!
Kyith is the Owner and Sole Writer behind Investment Moats. Readers tune in to Investment Moats to learn and build stronger, firmer wealth foundations, how to have a Passive investment strategy, know more about investing in REITs and the nuts and bolts of Active Investing.
Readers also follow Kyith to learn how to plan well for Financial Security and Financial Independence.
Kyith worked as an IT operations engineer from 2004 to 2019. Currently, he works as a Senior Solutions Specialist in Insurance Start-up Havend. All opinions on Investment Moats are his own and does not represent the views of Providend.
You can view Kyith's current portfolio here, which uses his Free Google Stock Portfolio Tracker.
His investment broker of choice is Interactive Brokers, which allows him to invest in securities from different exchanges all over the world, at very low commission rates, without custodian fees, near spot currency rates.
You can read more about Kyith here.
- My Dividend Experience Investing in UCITS iShares iBond Maturing in 2028. - April 23, 2024
- We Invest into Popular Funds When They Are Popular, Exactly When They Started Turning to Shxt. - April 22, 2024
- Meal Prep 2.0 – Cooking Your “Go-to” Meal that You Look Forward to Eating Everyday. - April 21, 2024